Section Branding
Header Content
It’s hot. Is that normal or is it climate change?
Primary Content

Mary Landers, The Current
If you’re like most Coastal Georgians, you know climate change is happening, but think it’s not happening to you. A survey completed last year by the Yale Program on Climate Change showed 70% of Coastal Georgians accept climate change as fact, but only 42% say they’ve personally experienced its effects.
Those 42% are probably wrong.
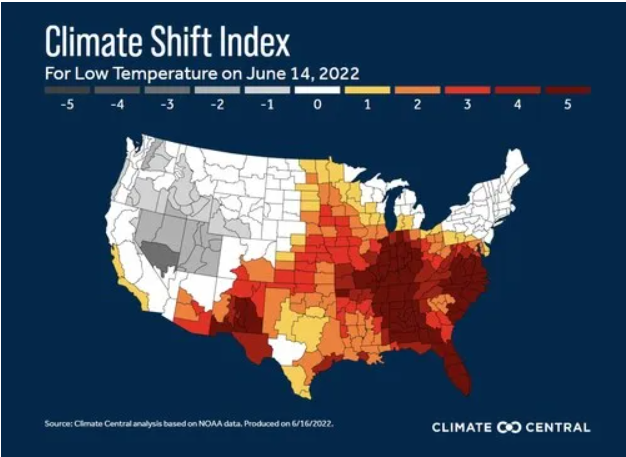
A new online tool called the Climate Shift Index shows why. Created by researchers at the nonprofit Climate Central, the index teases out the effect of climate change on daily temperatures all over the U.S., showing how the burning of fossil fuels has boosted the odds of any given daily high and low temperatures.
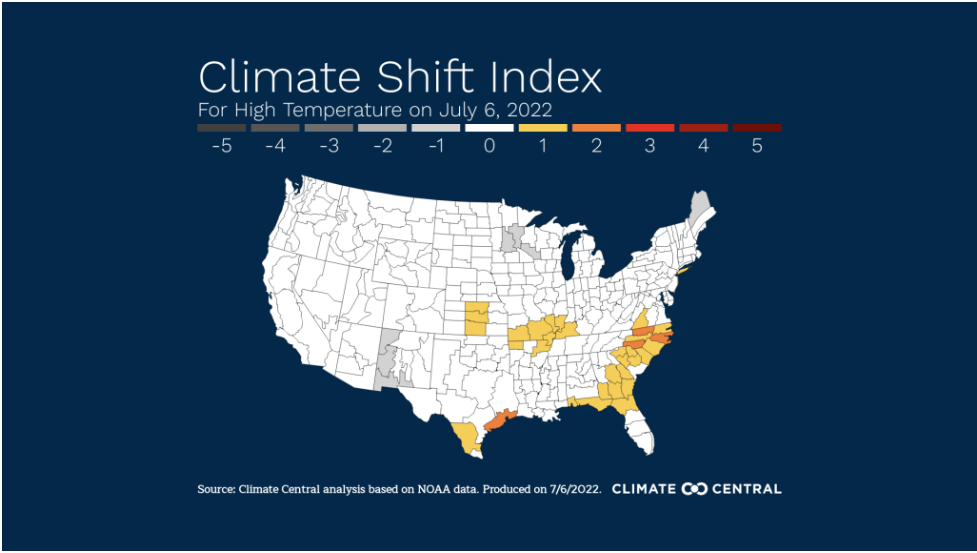
Take Wednesday, July 6 for example. The National Weather Service predicted a high temperature of 96.9 degrees Fahrenheit along the Georgia coast. That’s 4.8 degrees higher than the sweltering temperatures typical for that calendar day, as recorded over the last 30 years.
The date had a climate shift score of 1, meaning that abnormal temperature was about 1.5 times more likely to occur because of climate change. When temperatures are below normal, the index’s negative numbers indicate how much less likely those lower temperatures are.

The interactive Climate Shift Index shows additional details as the user navigates around the map. It’s designed to make incremental temperature changes easier to see, and serves as the latest tool in the burgeoning science of climate change attribution.
Attribution science typically applies to extreme weather events, such as hurricanes. With better computing power and a better understanding of the many factors that contribute to weather, the field has grown rapidly over the last decade. Reports of wildfires and hurricanes frequently include a mention of the role of climate change. Climate Central’s index applies the tools to everyday weather.
“The CSI is a useful tool because it finally brings climate attribution out of academia into the practitioner and public space,” said Marshall Shepherd, Georgia Athletic Association Distinguished Professor of Atmospheric Sciences and Geography and Director of the UGA Atmospheric Sciences Program.
For much of the U.S. including Coastal Georgia, climate fingerprints are most obvious not in the high daytime temperatures, but in the overnight lows, which don’t dip down like they used to do.
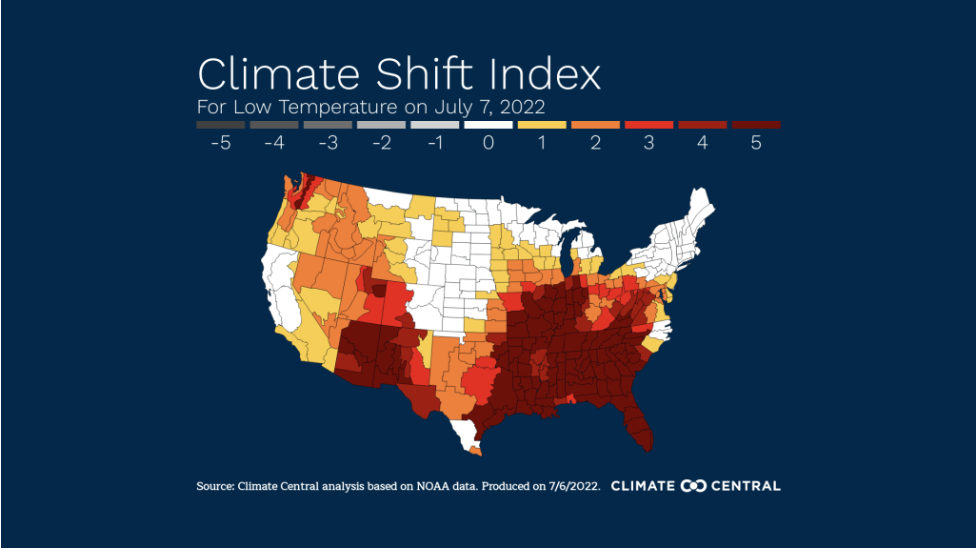
Thursday, July 7 offers a good example. The minimum temperature for the day was predicted to be 76.5 degrees Fahrenheit. That’s 3.2 degrees above the 30-year average. The blood red color in the map indicates the temperature was five times more likely to occur because of climate change.

As depicted in the map, this nighttime shift toward hotter-then-average weather is particularly evident in the Southeast.
“We’re seeing really strong robust signals of climate change that are shifting nighttime temperatures, what what I would refer to as minimum temperatures, all across the United States, but particularly in places like the Southeast where temperatures are strongly regulated by what’s going on with the radiation in your local area,” said Climate Central’s Daniel Gilford, who helped develop the index. “Temperatures just don’t have any way to cool off in the evening because there’s a lot of warm air that’s trapped near the surface.
“What this means is that the temperatures just don’t get as cold as they used to, and that means that the climate has changed.”
Many Americans may think of climate change as something that’s either going to occur in a far away place, or affect their grandchildren. Shepherd said couching climate issues in those terms is wrong. “The DNA of climate change is in today’s weather so using future tense is no longer appropriate,” he said.
This story comes to GPB through a reporting partnership with The Current, providing in-depth journalism for Coastal Georgia.

