Concept 20: Equilibrium Prices
Learn
Beginner
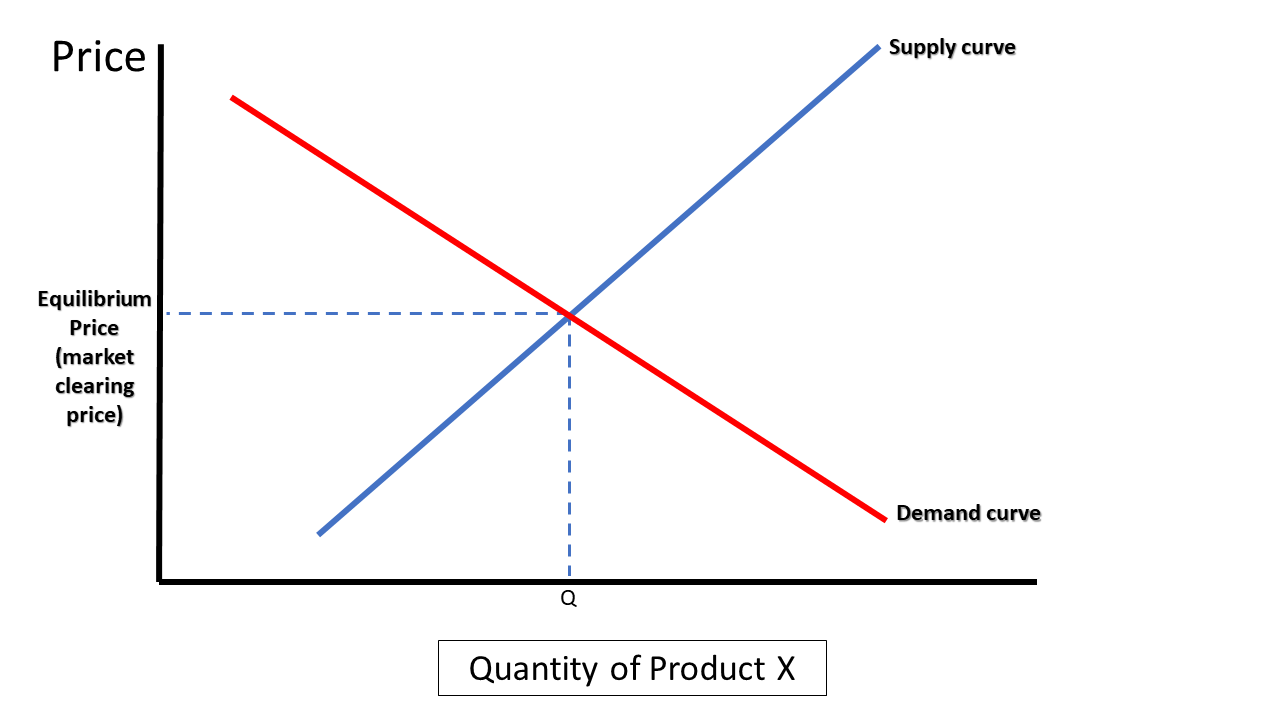
The equilibrium price, or market clearing price, of a good or service refers to the price at which the quantity demanded by consumers is equal to the quantity supplied by producers. At this price, there is no shortage and no surplus of the good or service. The equilibrium price is determined by buyers and sellers interacting with each other in a market. Graphically, the equilibrium price is shown by a point where a supply line crosses a demand line like the one seen in Graph 20-1.
Intermediate
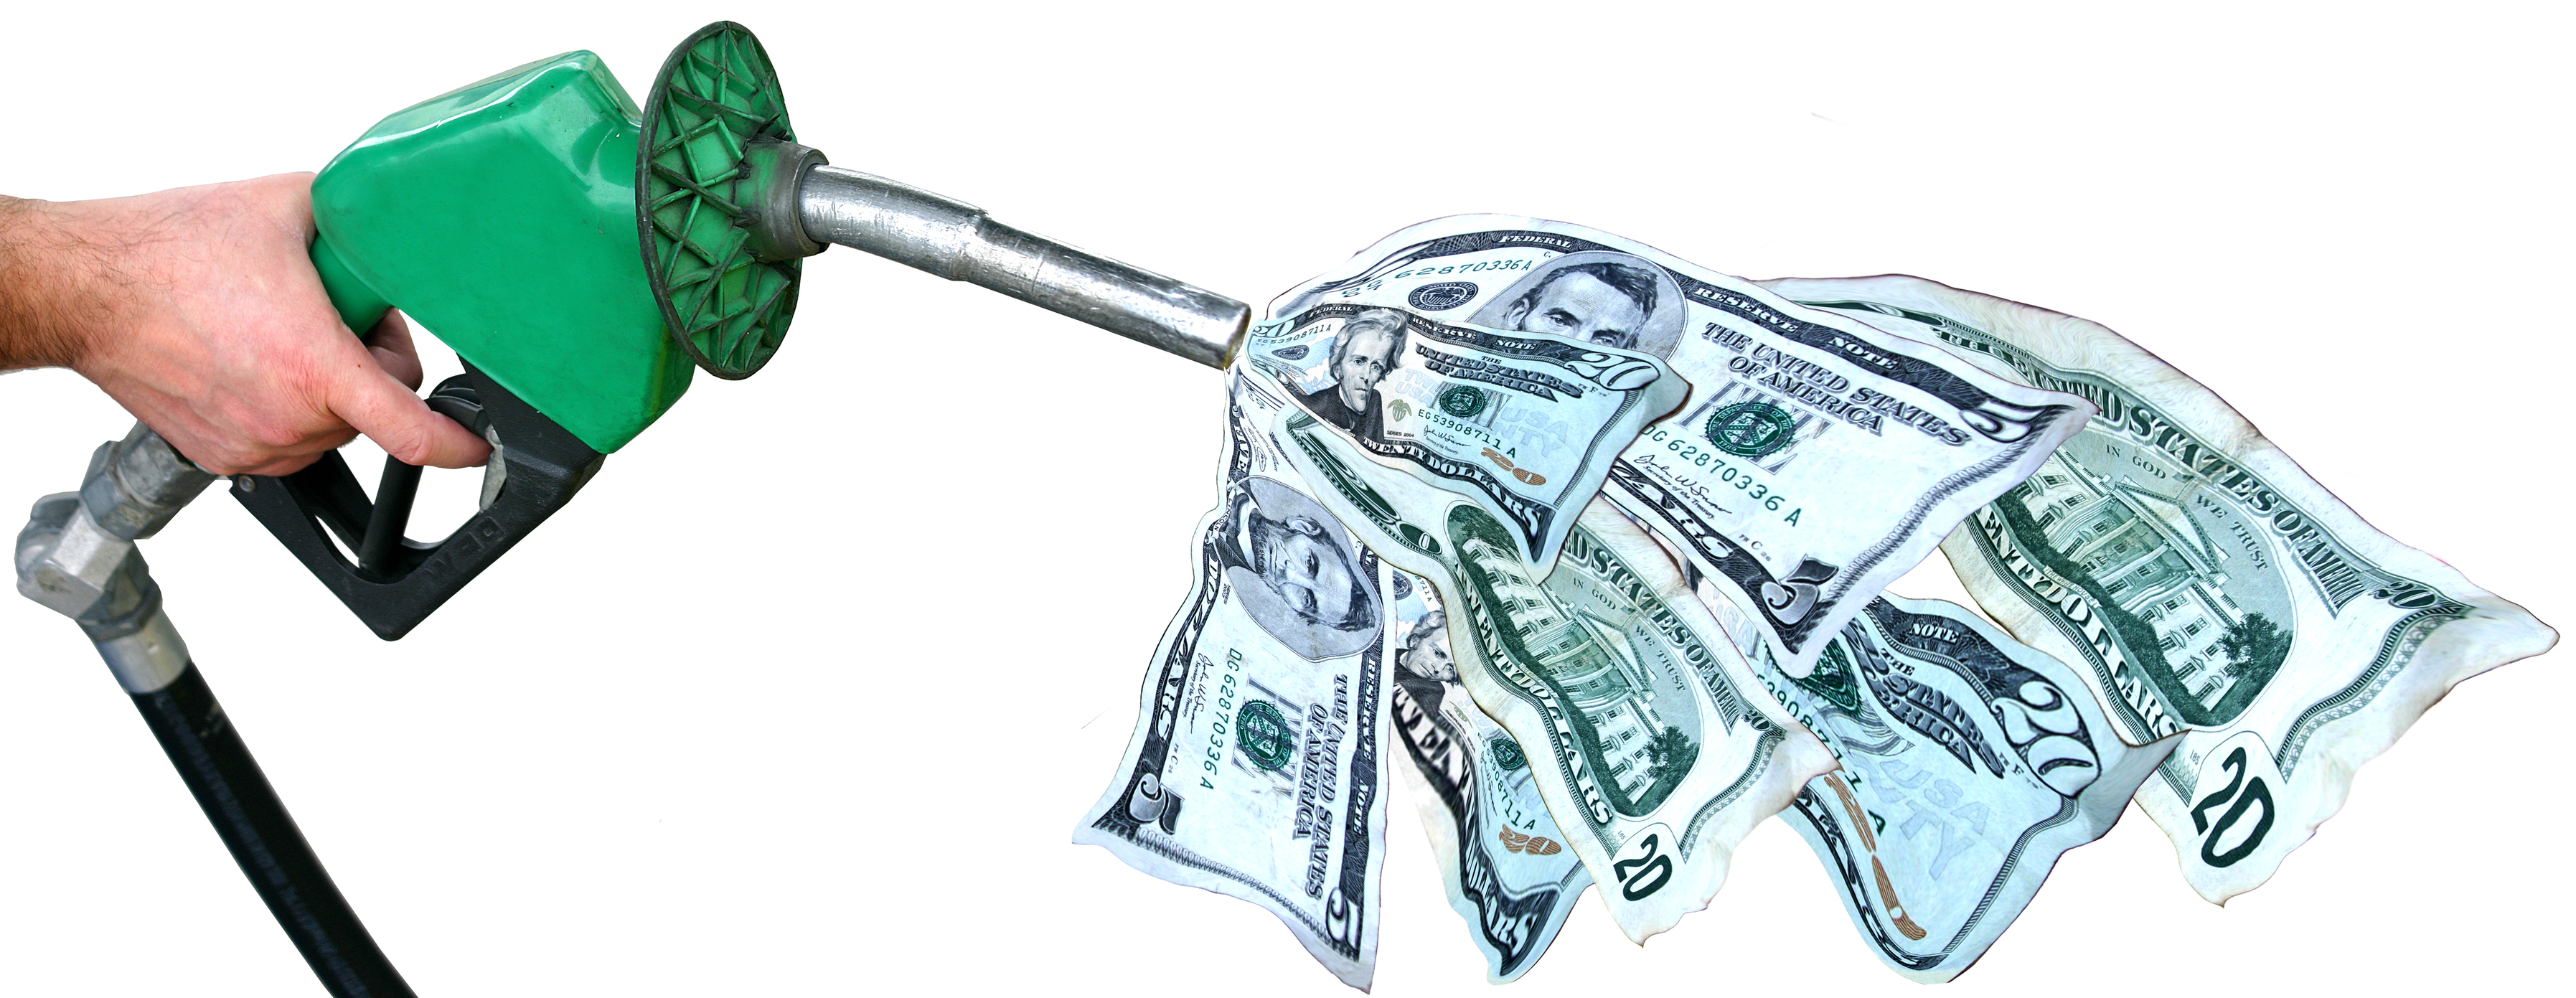
In Concept 18: Supply Shifters and Concept 19: Demand Shifters we explained how supply and demand curves shift over time in response to non-price determinants. It stands to reason, therefore, that equilibrium prices shift as well. In real life, markets do not stand still. There are constantly moving variables affecting both supply and demand at all times. For some markets these changes are rapid and visible, like how the price of gasoline or stocks change on a daily or even hourly basis. For other markets, changes are much slower. The equilibrium price (wage) for an NFL quarterback, for example, only gets negotiated every few years, and then prices are locked in by contract for an extended period of time.
Assuming no other changes in the market, increases in demand increase equilibrium prices and vice versa. Increases in supply decrease equilibrium prices and vice versa. If supply and demand are both shifting, the equilibrium price and/or quantity may be unknown depending on the magnitude of each shift. In the practice section of this concept, you can see visually why this is the case.
Advanced
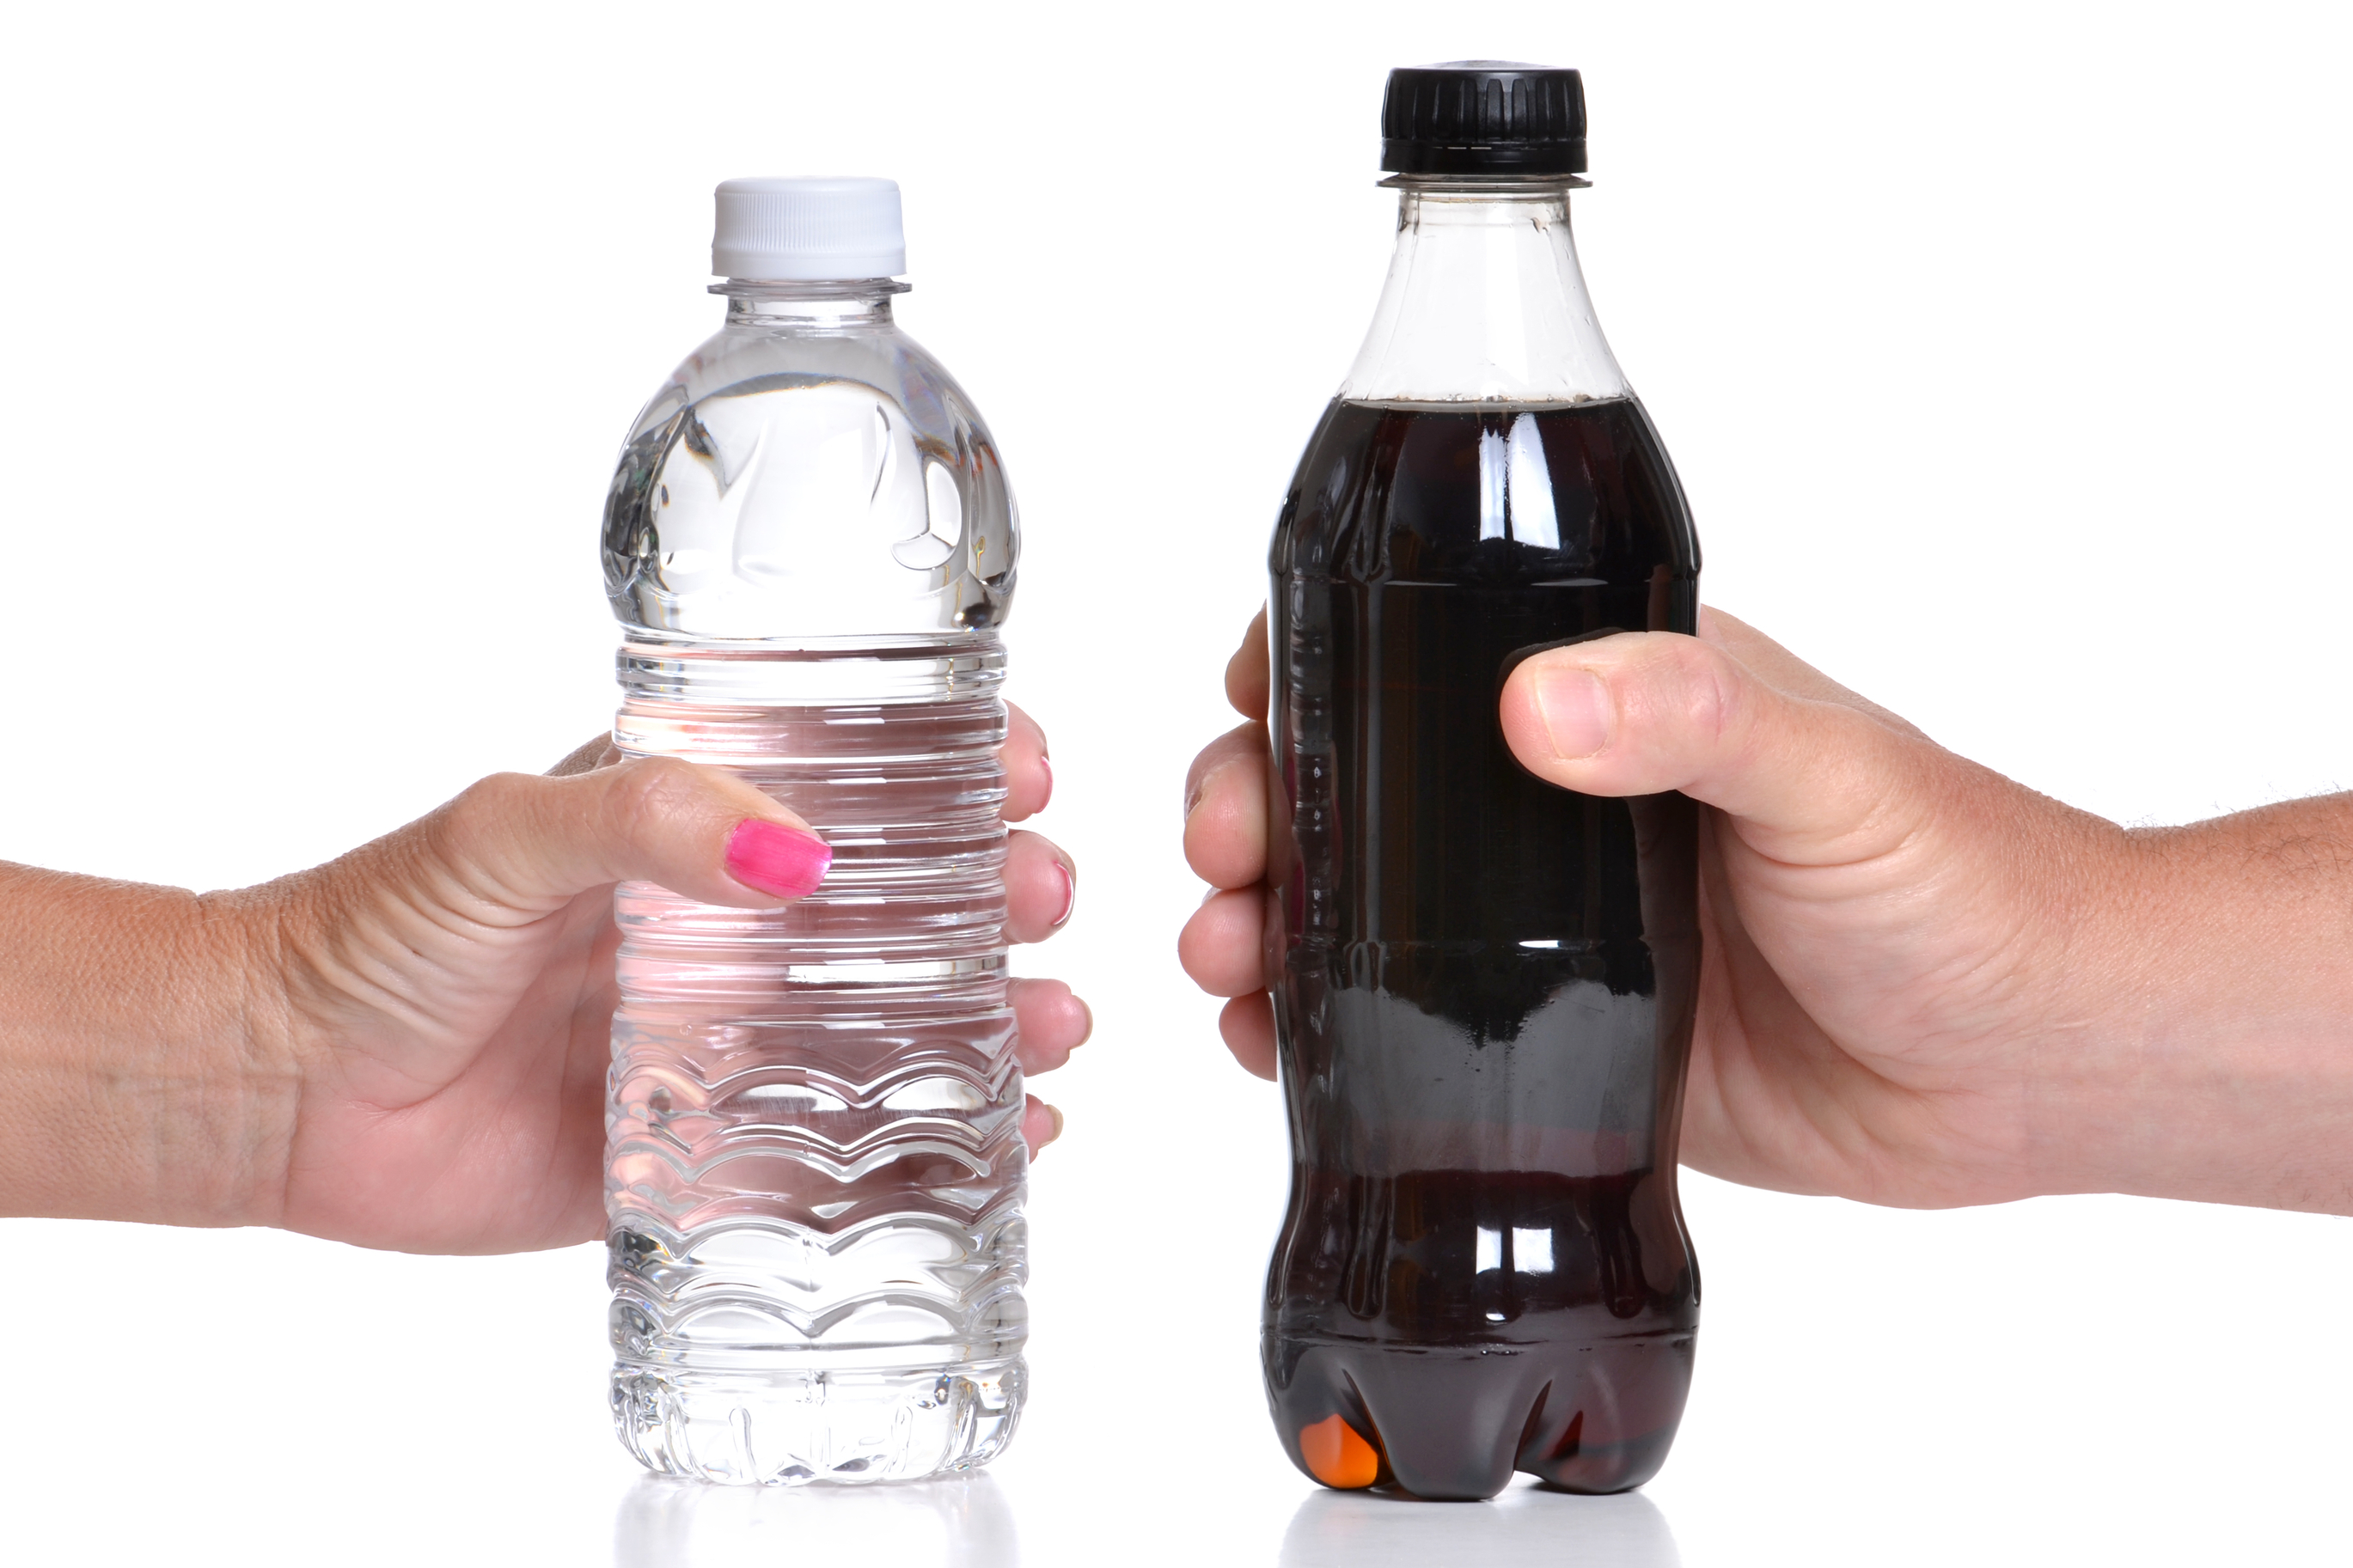
Remember that a supply and demand graph is a snapshot of a market in motion and is subject to several assumptions and limitations. In real life, it is more practical to think of the equilibrium “price” of an item as a range of prices. Take a 20-ounce bottle of cola for example. On any given day you can find them in vending machines for between $1 and $2, at some restaurants and gas stations for $2 - $3, or in six-packs selling for $5-$8 at the supermarket. However, you rarely (if ever) see them for free, and you probably never see them selling for $10 either. Therefore, we can reasonably conclude the equilibrium price for a single 20oz bottle of cola is somewhere between $1 and $3.
Click a reading level below or scroll down to practice this concept.
Practice
Assess
Below are five questions about this concept. Choose the one best answer for each question and be sure to read the feedback given. Click “next question” to move on when ready.
Social Studies
Explain how the law of demand, the law of supply, and prices work to determine production and distribution in a market economy.
Identify the determinants (shifters) of supply (e.g., changes in costs of productive resources, government regulations, number of sellers, producer expectations, technology, and education) and illustrate the effects on a supply and demand graph.
Identify the determinants (shifters) of demand (e.g., changes in related goods, income, consumer expectations, preferences/tastes, and number of consumers) and illustrate the effects on a supply and demand graph.